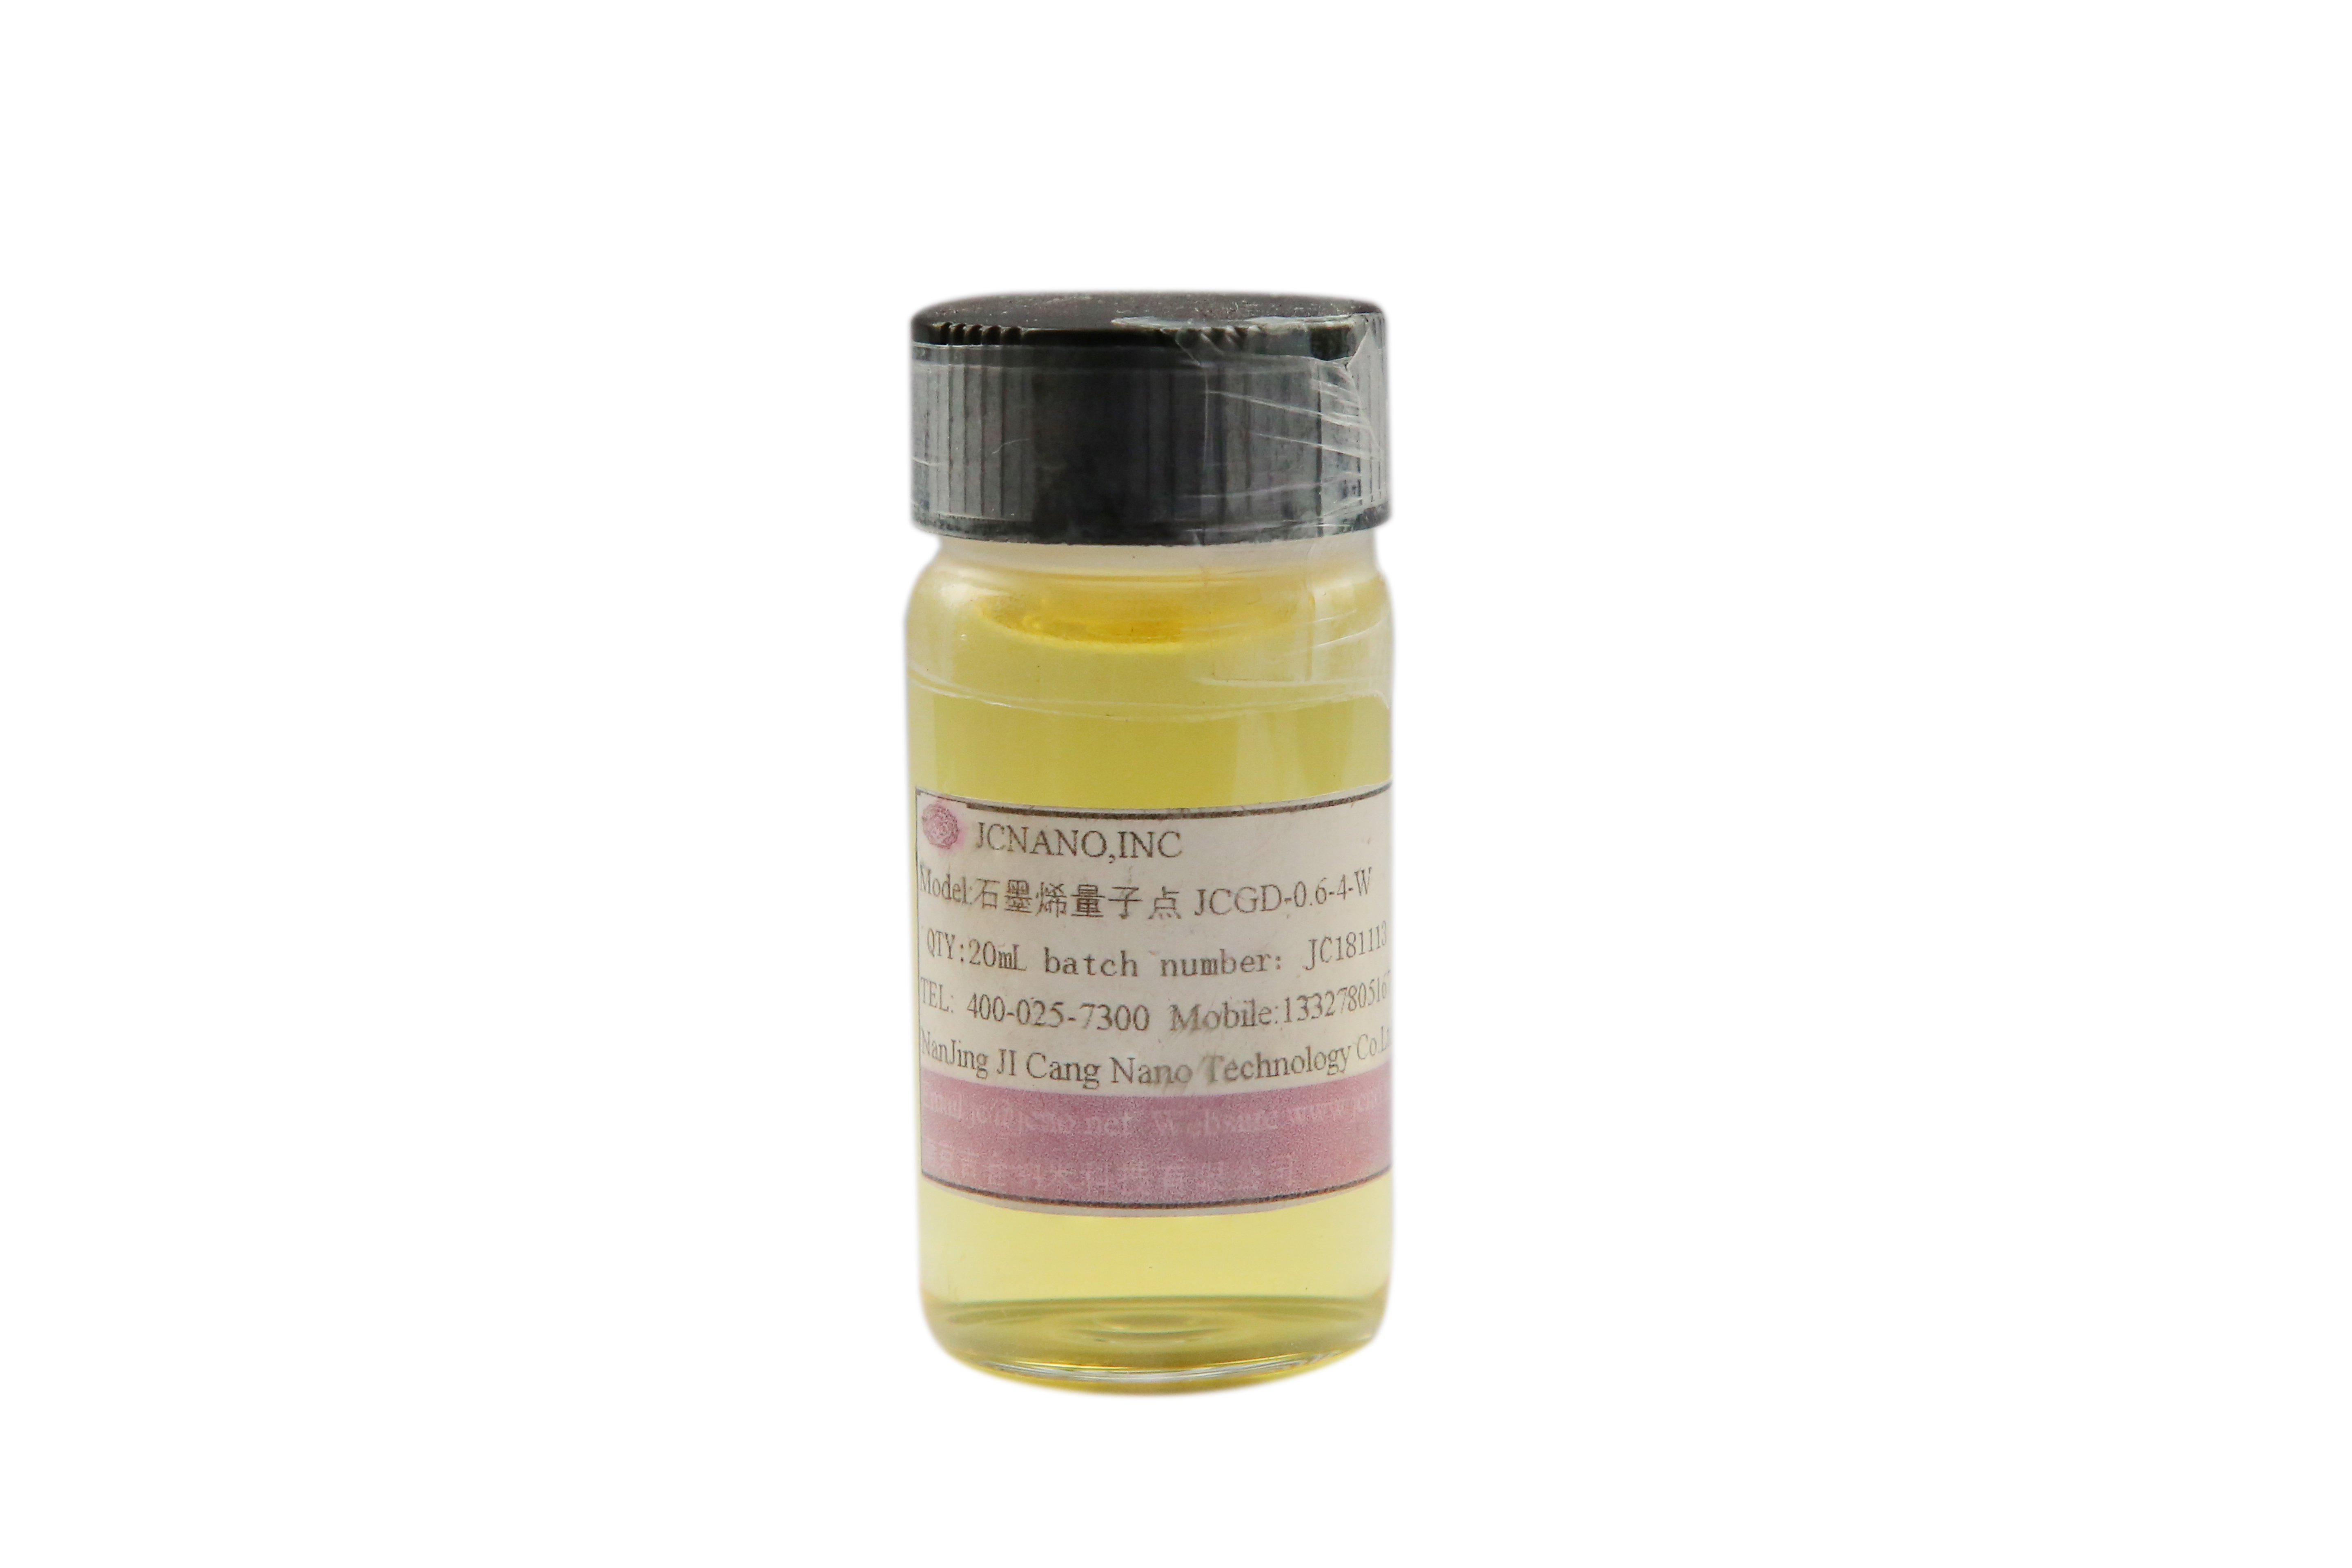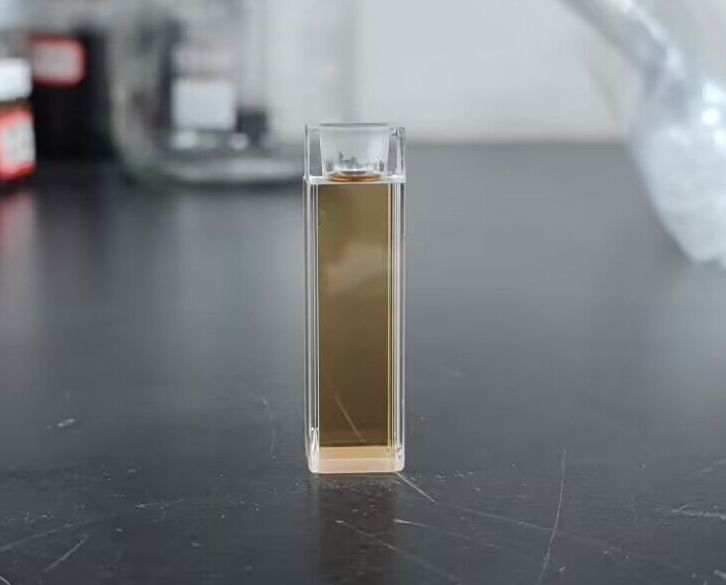
石墨烯量子点粉末JCGD-1-4,浓度0.05毫克/毫升
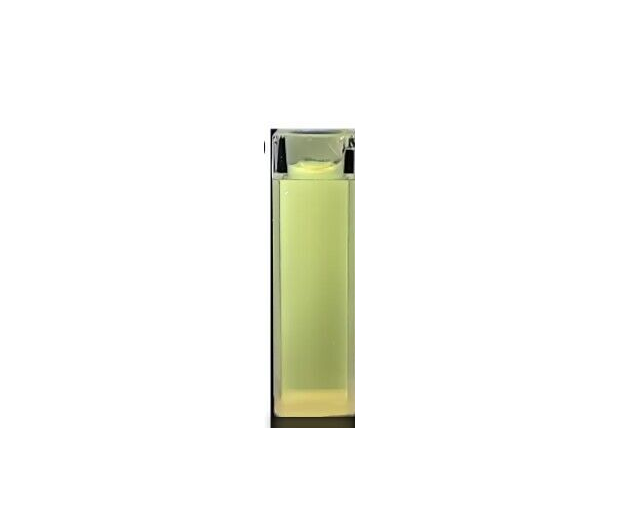
365nm紫外灯下的发光
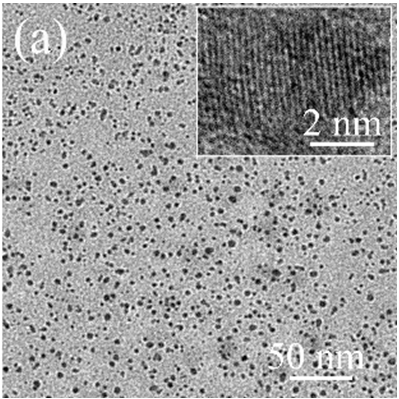
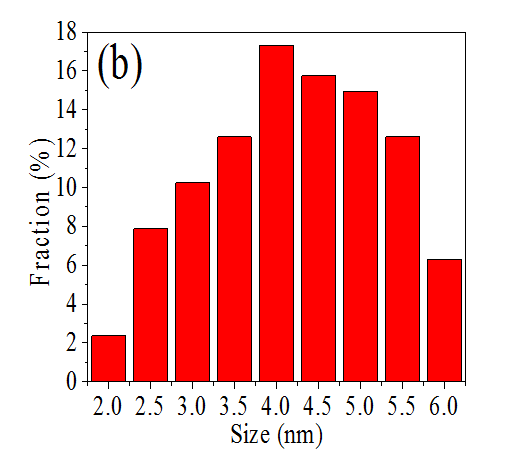
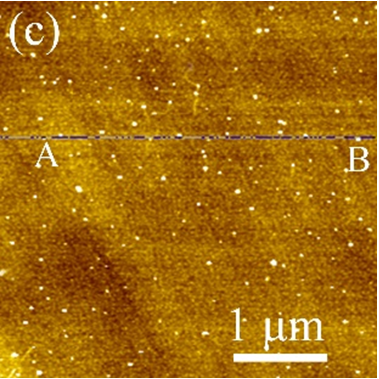
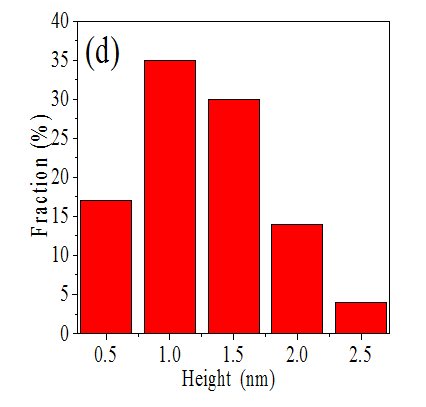

Fig. 1Microstructure of the as-prepared GQDs: (a) TEM image. Inset of (a): HR-TEM image. (b) Diameter distribution. (c) AFM image. (d) Height distribution.(e) Height profile along the line A–B.
Table 1 Inductively coupled plasma (ICP) analysis data of GQDs.
|
Samples(ppm) |
Fe |
Ni |
Mn |
Cu |
Na |
Ca |
|
GQDs |
2.6 |
0.8 |
0.8 |
3.6 |
130.7 |
270.5 |
|
|
|
|
|
|
|
Table 2 QY of GQDs using quinine sulfate as a reference.
|
Sample |
Integrated emission intensity (I) |
Abs. (A) |
Refractive index of solvent (n) |
Quantum yield (  ) ) |
|
Quinine sulfate |
65134.5 |
0.0523 |
1.33 |
0.54 (known) |
|
GQDs |
4321.6 |
0.0371 |
1.33 |
0.051 |
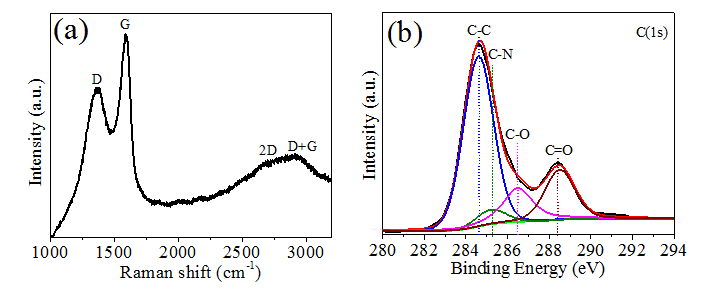
Fig. 2 (a) Raman spectrum of the GQDs. (b) XPS spectrum of the GQDs.

Fig. 3(a)UV-vis absorption spectrum of the GQDs at different excitation wavelengths. Inset: Optical photograph of the GQDs dispersed in water under different wavelengths irradiation. (b) PL spectra of the GQDs at excitation wavelengths from 260 to 580 nm.
荧光量子产率:4%左右,激发波长:280-460nm,发射峰:521—529nm
JCGD-1-4粉末价格:2500元/100毫克、4250元/200毫克、9000元/500毫克
JCGD-1-4-W水分散液价格:100元/20毫升,浓度0.25毫克/毫升
jc@jcno.net